
Developing tools for genome editing of plant genomes using plant RNA viruses
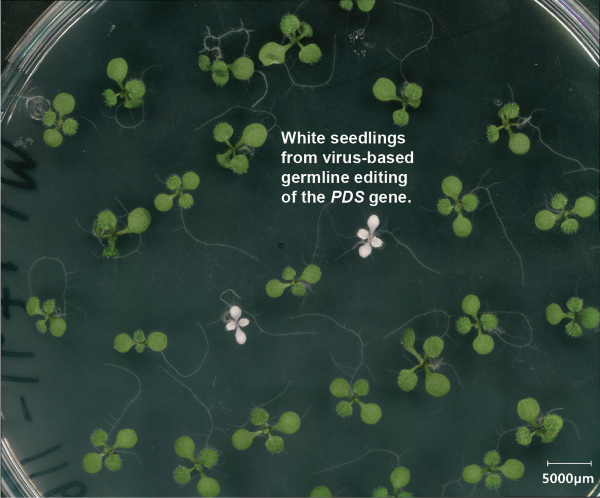
RNA viruses are interesting vehicles for delivering proteins and RNAs to plants given their natural ability to replicate and spread throughout plants. They replicate purely by RNA and therefore do not leave traces of themselves in plant genomes. They also can gain access to the germline of plants and yet are themselves restricted from passing to future generations. Because of the limited cargo capacity of these viruses, it has not been possible to encode common CRISPR systems like Cas9 inside of them. To solve this problem, we have been working on engineering a set of tiny CRISPR systems that are small enough to be encoded in plant viruses. Our first demonstration of this approach working was recently published (Nature Plants 2025), in which we showed that a modified tobacco rattle virus could cause germline editing in Arabidopsis when carrying a tiny CRISPR enzyme called TnpB. The UCLA-DOE project is mainly aimed at improving and augmenting these systems to increase their efficiency, so they may be someday used for plant CRISPR screens as well as engineering of crop plants. This involves structure guided mutational analysis and bacterial evolution screens to find Tnp enzymes with greater activity, coupled with structural analysis of TnpB proteins along with their guide RNAs.